Developer Dashboard Asserts and Critical Events in SharePoint 2010

In SharePoint 2010 you can enable the Developer Dashboard feature. If you are not sure how then check out my blog How to Enable the Developer Dashboard in SharePoint 2010. Besides giving you all the stats that look cool, the main purpose of the dashboard is to provide you additional performance and tracing information that can be used to debug and troubleshoot issues with page rendering time. If you are not a developer, you are probably saying “Ya, whatever!”, but if you are a developer you are most likely to really appreciate the dashboard.
Even if you are not a developer, I suggest you turn on this feature (by default it is turned off) because you never know when you might find it useful. If nothing else, you might appreciate the Asserts and Critical Events section of the Developer Dashboard.
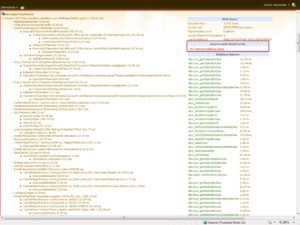
Notice the red warning in that section that is telling me that there is an issue with the publishing cache that I need to look into. It even gives me the Event ID number so I can go my event logs and figure out what’s going on.
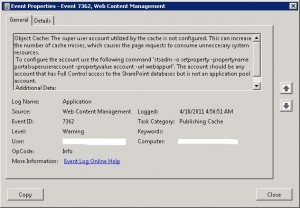
Here’s what my event log shows.


